
A graphics card that sits at high usage while you stare at an empty desktop is a different problem from a card that maxes out inside a game. In-game load is the card doing its job. Desktop load with nothing open means something is quietly renting your GPU: an animated wallpaper, a browser tab you forgot, a recording overlay, a driver stuck after an update, or, in the worst case, a process that does not want to be found. This guide works through the causes in the order they actually occur, starting with how to read the number correctly, because the percentage graph alone lies often enough to send people chasing ghosts.
As an Amazon Associate, we earn from qualifying purchases.
Quick Answer
Start by opening Task Manager and sorting the GPU column to name the exact process using the card. Most desktop load comes from live wallpaper apps, a browser with hardware acceleration and a video tab, or overlay and RGB software. End or disable the culprit, then check driver power state. If usage falls the moment Task Manager opens, treat the machine as infected and scan it.
Step One: Read the Right Number Before Fixing Anything
The headline GPU percentage in Task Manager is the busiest single engine on the card, not total load. A card can show near-full usage because a tiny video decode job is saturating the small dedicated decode engine while the 3D engine idles. Click the GPU page and look at the separate graphs for 3D, Video Encode, Video Decode and Copy. Note which engine is busy, because that one detail splits this whole guide in two: a busy decode engine points at browsers, video tabs and wallpaper, while a busy 3D engine points at renderers, overlays and unknown processes.
Next, check clocks and power alongside usage. Monitoring tools and the GPU vendor app show core clock, memory clock and board power draw. A card showing high usage but sitting at idle clocks and low wattage is usually a reporting quirk or a trivial job on a small engine. A card pinned at boost clocks with fans spinning on an empty desktop has a real workload, and that workload has a name. Your job in the next step is simply to find it.
Step Two: Name the Process, Then Work the Usual Suspects
Open Task Manager, go to the Processes tab, right-click the column header and enable the GPU and GPU Engine columns. Sort by GPU descending and leave the window open for a minute. The top entry is your answer in most cases, and it is usually one of these.
Animated wallpaper is the single most common cause. Live wallpaper apps render a real 3D scene or a looping video behind your icons all day. Pause the wallpaper or set it to stop when another window is focused or fullscreen, and watch usage fall. Browsers are next: hardware acceleration lets a browser hand video and page rendering to the GPU, and one pinned tab with a muted autoplay video, a web game left open, or a streaming dashboard can hold the decode and 3D engines busy indefinitely. Close tabs in halves to find the offender, and consider turning hardware acceleration off as a test.
Overlays and capture tools follow. Game overlays, instant replay features and desktop recording in GPU vendor apps keep a capture buffer running even when no game is open. RGB suites, motherboard control centers and fan utilities with animated dashboards are quieter culprits, and so are second instances of launchers minimized to the tray. End each suspect once, watch the graph for thirty seconds, and you will see the step down when you hit the right one.
Step Three: Driver and Windows Causes
If no user app explains the load, look at the platform layer. Desktop Window Manager, listed as dwm.exe, legitimately uses the GPU to compose the desktop, and its load climbs with resolution, monitor count and refresh rate. Two or three high-refresh monitors can also hold memory clocks at maximum on an otherwise idle card, because the card refuses to downclock its memory while driving several fast panels. That state looks alarming in a monitoring tool but is a known power-management behavior; lowering one monitor’s refresh rate as a test confirms it within seconds.
A driver that misbehaves after a Windows or driver update is the other platform cause: the card never drops to its idle power state, and usage hovers with no process to blame. Update to the current driver first. If the problem started right after an update, roll back one version, and if neither helps, do a clean driver installation with the clean-install option or a driver removal tool in Safe Mode, then install a known stable release. While you are in settings, toggle hardware-accelerated GPU scheduling once and retest, since a stuck scheduling state survives ordinary restarts on some systems.
Step Four: Rule Out the Process That Hides
One pattern demands a different response: usage is high, fans spin up on an idle machine, yet every time you open Task Manager the load drops to nothing within seconds. Some mining malware watches for monitoring tools and pauses while it is observed. Other warning signs are an unnamed or vaguely named process in the startup list, usage that peaks when the machine sits untouched, and a card that runs hot overnight.
Do not try to out-stare it. Run a full scan with your installed antivirus, then a second-opinion scanner, then an offline scan that runs before Windows loads, because a miner that hides from Task Manager has already shown it will hide from casual tools. Check the startup tab and scheduled tasks for entries you do not recognize. If scans come back clean but the behavior continues, back up your files and treat a clean Windows installation as the honest fix rather than a defeat.
Step Five: The Hardware Side of an Idle Card
Software is the usual answer, but heat imitates load. A dust-choked heatsink or a fan that has failed makes the card run hot at trivial workloads, and owners often read the temperature and fan noise as high usage. Clean the card and case filters, confirm every fan spins, and check the fan curve in your control software: an aggressive custom curve can hold fans at high speed long after the actual workload ends. On an older card, dried thermal paste raises idle temperatures and keeps clocks and fans busier than they should be at rest.
How to Choose Your Fix Path
Match the path to the pattern. A named app at the top of the GPU column means you fix software settings, not hardware. A busy decode engine with low clocks means a browser or wallpaper job, annoying but harmless. Boost clocks with no named process means driver power states first, malware scan second. Fans loud but usage genuinely low means you have a cooling or fan curve problem wearing a usage costume. Work the pattern you actually see and you will rarely need more than two of the steps above.
Gear That Helps You Confirm and Fix It
None of this requires new hardware, but four inexpensive tools turn guessing into measuring, and one protects the machine while you work on it.
P3 Kill A Watt Electricity Usage Monitor (P4400)

A plug-in watt meter settles the argument about whether the card is really working. Plug the PC into it and watch the wall draw at the desktop: a system idling normally sips power, while a card under hidden load pulls visibly more and keeps the fans audible.
Specs
- Measures watts, voltage, current and cumulative kilowatt-hours; rated for standard household outlets up to 15 amps; LCD readout on the unit.
Metro DataVac ED500 Electric Duster
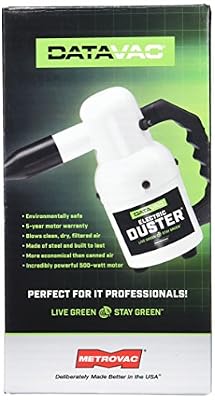
For the dust step, a corded electric duster replaces canned air and never runs out mid-clean. Hold fan blades still while you blow out the heatsink and case intakes so the fans do not overspin.
Specs
- 500-watt motor, 0.75 peak horsepower; steel body; 12-foot cord; includes concentrator and flare nozzles plus a micro cleaning tool kit.
Noctua NT-H1 Thermal Paste

If an older card idles hot after cleaning, fresh paste on the GPU die is the remaining maintenance step, and it is also the standard pick for CPU coolers during the same teardown.
Specs
- 3.5-gram syringe; no curing time required; manufacturer-rated for long-term stability on CPU and GPU dies.
CyberPower CP1500PFCLCD UPS

Driver reinstalls and clean Windows installs are the moments a PC is most exposed to a power cut. A pure sine wave UPS keeps the machine alive through a brownout while you flash, install and reboot.
Specs
- 1500 VA / 1000 W capacity; pure sine wave output; 12 outlets; LCD status panel; automatic voltage regulation.
SanDisk Ultra Flair 64GB USB 3.0 Flash Drive

A dedicated flash drive carries the offline scan boot media and the clean Windows installer from step four, kept separate from your everyday files so it stays trustworthy.
Specs
- 64GB capacity; USB 3.0 interface with backward compatibility; metal casing; speeds up to 150 MB/s reads per the manufacturer.
Who Should Skip This Guide
Skip it if your card only reaches high usage while a game, renderer or AI workload is open: that is the card working as designed, and the separate guide to GPU load during games covers that case. Skip it if your numbers come from a laptop running on its integrated display, where the discrete GPU wakes for the external monitor instead and the fix path is different. And skip the software steps entirely if the card shows visual artifacts or crashes under any load at all, because that is a failing-hardware conversation, not a settings one.
Frequently Asked Questions
Is some GPU usage on the desktop always normal?
Yes. Desktop composition, your browser and background apps keep a healthy card somewhere in the low single digits to low teens of usage in short bursts. Sustained high usage with fans audible and clocks at boost on an empty desktop is the abnormal pattern worth chasing.
Why does my GPU usage drop when I open Task Manager?
That specific behavior is a recognized red flag. Some mining malware detects monitoring tools and suspends itself while observed. Run a full scan, a second-opinion scan and an offline scan, and check startup entries and scheduled tasks for anything you cannot identify.
Can multiple monitors cause high idle GPU usage?
Yes. Several high-refresh monitors can stop the card from dropping its memory clock at idle, which monitoring tools display as a busy, warm card. Testing one monitor at a lower refresh rate confirms it in seconds, and the state is a power-management quirk rather than a fault.
Should I reinstall my GPU driver first or last?
Neither. Name the process first, because most cases end there. Driver work comes after the software suspects and before the malware conclusion, unless your symptoms began immediately after a driver or Windows update, in which case move the driver step to the front of the queue.
Final Verdict
High GPU usage on an idle desktop is almost never a mystery once you read the right engine graph and sort Task Manager by the GPU column. Live wallpaper, a forgotten browser tab and overlay software explain most cases, driver power states explain most of the rest, and the small remainder, the process that hides when watched, deserves a full security response rather than more settings tweaks. Measure with a watt meter if you doubt the software readings, keep the card clean, and your GPU will go back to being bored on the desktop, which is exactly what it should be.
Product and ASIN Reference
| Product | ASIN |
|---|---|
| P3 Kill A Watt Electricity Usage Monitor (P4400) | B00009MDBU |
| Metro DataVac ED500 Electric Duster | B001J4ZOAW |
| Noctua NT-H1 Thermal Paste | B002CQU14A |
| CyberPower CP1500PFCLCD UPS | B00429N19W |
| SanDisk Ultra Flair 64GB USB 3.0 Flash Drive | B015CH1NAQ |