
The most powerful computer in the world right now is El Capitan, the HPE Cray EX supercomputer running at Lawrence Livermore National Laboratory, which benchmarks at roughly 1.742 exaflops on the Top500 list’s Rmax measurement. That’s 1.742 quintillion floating point calculations per second, achieved using AMD Instinct MI300A accelerators across more than 11 million combined CPU and GPU cores. But raw exaflop figures don’t mean much until you translate them into something tangible, so this article breaks down the node counts, power draw, and cooling demands of the top systems, then converts that into a real-world comparison: how many gaming PCs would you need to match the compute packed into a single supercomputer rack.
As an Amazon Associate we earn from qualifying purchases at no extra cost to you.


What “Most Powerful” Actually Measures
Supercomputer rankings come from the Top500 list, updated twice a year, using the LINPACK benchmark to measure sustained double-precision floating point performance (Rmax) against theoretical peak performance (Rpeak). A machine can have a huge Rpeak on paper but a much lower Rmax once you account for real-world inefficiencies in memory bandwidth, interconnect latency, and power throttling. When people ask which computer is “most powerful,” they usually mean Rmax, since that reflects sustained performance rather than a marketing ceiling.
There’s also a separate ranking, Green500, which measures performance per watt rather than absolute speed. A system can top Green500 without coming anywhere near the Top500 crown, because efficiency and raw throughput are different engineering goals.
The Current Top Systems
These are the exaflop-class and near-exaflop systems that have held top rankings through 2025 into 2026. Figures are drawn from official Top500 submissions.
| System | Location | Rmax (exaflops) | Cores | Power Draw |
|---|---|---|---|---|
| El Capitan | Lawrence Livermore National Laboratory, USA | 1.742 | ~11.4 million | ~29.6 MW |
| Frontier | Oak Ridge National Laboratory, USA | 1.353 | ~9.4 million | ~24.6 MW |
| Aurora | Argonne National Laboratory, USA | 1.012 | ~9.7 million | ~38.7 MW |
| Fugaku | RIKEN Center, Japan | 0.442 | ~7.6 million | ~29.9 MW |
| JUPITER | Forschungszentrum Jülich, Germany | ~0.79 (partial system) | ~5+ million (est.) | ~18.5 MW (est.) |
El Capitan’s power draw alone, at roughly 29.6 megawatts, is enough to supply around 20,000 average US homes continuously. That’s the cost of admission for exaflop computing: these aren’t machines you plug into a wall circuit, they’re machines that need dedicated substation capacity.
Worked Calculation: How Many Gaming PCs Equal One Supercomputer Rack
El Capitan isn’t one giant chip, it’s built from thousands of individual compute blades organized into cabinets, each cabinet holding multiple nodes. To make the scale concrete, let’s convert one standard rack’s worth of compute into gaming PC equivalents.
- Step 1 – System-wide FP64 throughput: El Capitan delivers 1.742 exaflops (1,742,000 teraflops) of double-precision performance across the entire machine.
- Step 2 – Per-rack share: El Capitan uses roughly 160 cabinets. Dividing total throughput evenly gives approximately 10,890 teraflops of FP64 performance per rack.
- Step 3 – Gaming GPU FP64 baseline: A high-end gaming GPU in the RTX 5090 class delivers roughly 1.6 teraflops of FP64 performance (consumer GPUs deliberately cripple double-precision math, since games don’t need it, in favor of FP32 and tensor throughput).
- Step 4 – Divide: 10,890 TFLOPS ÷ 1.6 TFLOPS per card ≈ 6,806 gaming GPUs to match the FP64 output of a single rack.
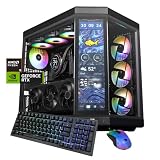
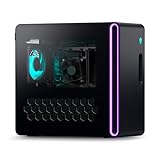
Assuming one GPU per gaming PC, that means matching just one rack out of 160 would take roughly 6,800 fully built high-end gaming systems, not just graphics cards. Scale that across the entire machine and you’re looking at over a million equivalent gaming PCs to match El Capitan’s total FP64 throughput, though in practice this comparison is theoretical since coordinating that many independent systems over consumer networking would introduce latency and synchronization losses that erase any benefit.
If you instead compare using FP32 or AI-relevant tensor throughput, where consumer GPUs are far less crippled, the gap narrows to the low thousands per rack rather than tens of thousands, because supercomputer nodes built for scientific double-precision work don’t get the same architectural advantage gaming silicon gets from mixed-precision tensor cores.
Why the Gap Is About More Than Raw Flops
Comparing teraflops is a useful gut-check, but it understates what actually separates a national-lab supercomputer from a warehouse full of gaming rigs.
- Interconnect bandwidth: Supercomputer nodes communicate over specialized fabric like Slingshot or InfiniBand at hundreds of gigabytes per second with microsecond latency. Gaming PCs networked over standard Ethernet or Wi-Fi would bottleneck almost instantly on any workload requiring node-to-node communication.
- Memory architecture: HPC nodes use unified memory pools (like MI300A’s shared CPU/GPU memory) sized in terabytes per node, letting a single simulation address memory no consumer motherboard could hold.
- Reliability engineering: Supercomputers run for weeks on a single job. A cluster of consumer GPUs, without server-grade error correction and redundancy, would statistically hit a memory or thermal fault well before a long simulation finished.
- Cooling density: These systems use direct liquid cooling piped to every node. Gaming PCs rely on air or closed-loop liquid cooling that can’t sustain the same density without massive floor space.
Power Budget in Perspective
To put the megawatt figures in context, here’s what similar power draw looks like at a scale gamers can relate to.
| Power Draw | Real-World Equivalent |
|---|---|
| ~29.6 MW (El Capitan) | Roughly 65,000 gaming PCs running at 450W under full load simultaneously |
| ~1 MW | About 2,200 gaming PCs at full load, or a mid-size data center hall |
| ~450W | One high-end gaming PC (RTX 5090-class build) under sustained gaming load |
This is also why Green500 rankings matter: a facility drawing 29.6 MW needs industrial power contracts and dedicated cooling infrastructure that no standard building, let alone a home, could provide.
What This Means If You’re Comparing Hardware, Not Just Reading Trivia
If your actual interest is understanding where your own gaming PC sits on this scale, the honest takeaway is that it doesn’t, not in any meaningful sense. A single RTX 5090-class card benchmarks in the tens of teraflops for gaming-relevant FP32 and tensor workloads, which sounds impressive until you remember a top supercomputer is running roughly a hundred thousand times that, sustained, across a machine engineered specifically so those cores can talk to each other without stalling. The comparison is fun for scale, but the architectures solve completely different problems: your PC renders frames in milliseconds, a supercomputer runs climate models and nuclear stockpile simulations for weeks without stopping.
FAQ
Is El Capitan definitely the fastest computer in the world in 2026?
Based on the most recent Top500 rankings, yes, at roughly 1.742 exaflops Rmax. Top500 updates in June and November each year, so it’s worth checking the latest list since new systems like JUPITER’s full deployment could shift rankings.
Could quantum computers beat these numbers?
Not for general-purpose workloads. Quantum systems currently outperform classical supercomputers only on narrow, specialized problems (certain sampling and optimization tasks), not on the broad scientific simulation work exaflop machines are built for.
Why don’t supercomputers just use gaming GPUs to save cost?
Some do use consumer-derived architectures, but data-center accelerators add ECC memory, higher double-precision throughput, and NVLink/Infinity Fabric-class interconnects that consumer cards lack, all of which are required for multi-week scientific jobs to finish without errors.