
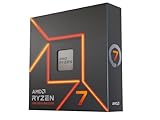
Choosing between the Ryzen 7 7700X and the Ryzen 7 7800X3D is one of those decisions that looks simple on paper but gets complicated the moment you open a benchmark spreadsheet. Both chips offer eight cores, both sit on the same AM5 platform, and both are built on Zen 4. The difference is a slab of extra cache stacked vertically on one of them, and that single architectural choice reshapes the entire performance picture depending on your resolution, your GPU, and what you actually do with your PC.
The situation where this comparison matters most is the builder who wants a fast gaming CPU but is tempted by the price gap. The 7700X launched at $349, the 7800X3D at $449, and street prices in 2026 have drifted closer together as both parts moved past their initial scarcity. A $100 spread might not sound like much until you realize it represents roughly 30 percent of the 7700X’s launch cost. Whether that premium buys you meaningful frame rate gains or merely a slightly higher ceiling you cannot use is the question this comparison answers.
As an Amazon Associate we earn from qualifying purchases at no extra cost to you.

Quick Verdict
The Ryzen 7 7800X3D is the clear choice if gaming is your primary workload. Its 3D V-Cache delivers a consistent and often dramatic uplift in frame rates at 1080p and 1440p, with diminishing but still real advantages at 4K. The Ryzen 7 7700X makes sense if you need a balanced chip for mixed workloads, want to save $50 to $100 for other components, or are pairing with a GPU that will bottleneck your system regardless of CPU choice. Neither CPU is a bad buy; the question is whether you need the cache or merely want it.
Specs Side by Side
| Specification | Ryzen 7 7700X | Ryzen 7 7800X3D |
|---|---|---|
| Cores / Threads | 8 / 16 | 8 / 16 |
| Architecture | Zen 4 | Zen 4 with 3D V-Cache |
| Base Clock | 4.5 GHz | 4.2 GHz |
| Max Boost Clock | 5.4 GHz | 5.0 GHz |
| L2 Cache | 8 MB (1 MB per core) | 8 MB (1 MB per core) |
| L3 Cache | 32 MB | 96 MB (64 MB stacked) |
| Memory Support | DDR5-5200 (dual channel) | DDR5-5200 (dual channel) |
| PCIe Version | PCIe 5.0 | PCIe 5.0 |
| TDP | 105 W | 120 W |
| Integrated Graphics | Radeon 2 CU (RDNA 2) | Radeon 2 CU (RDNA 2) |
| Socket | AM5 | AM5 |
| Launch MSRP | $349 | $449 |
Gaming Performance
This is where the 3D V-Cache earns its keep. The 7800X3D does not run at higher clocks, does not have more execution units, and does not feature any other microarchitectural advantage. It simply has three times the L3 capacity, and modern game engines lean heavily on cache for asset streaming, AI pathfinding, and physics calculations. The practical effect is fewer cache misses, fewer stalls waiting for main memory, and higher minimum frame rates.
1080p
At 1080p with a high-end GPU, TechPowerUp and Hardware Unboxed launch reviews placed the 7800X3D roughly 18 to 25 percent ahead of the 7700X in pure CPU-bound scenarios across a representative gaming suite. Gamers Nexus highlighted that the gap widens further in competitive titles like Counter-Strike and Valorant where frame times are extremely short and cache latency matters disproportionately. In practice, this means the 7800X3D sustains 144 to 165+ FPS in titles where the 7700X might dip to 120 to 140, assuming a powerful enough GPU is feeding frames into the pipeline.
1440p
The percentage advantage narrows as GPU load increases. Tom’s Hardware and TechSpot both observed the 7800X3D pulling ahead by approximately 10 to 18 percent at 1440p depending on the title. Games with heavy open-world streaming or large entity counts (City Skylines 2, certain MMOs) preserve more of the CPU-side advantage, while graphically demanding AAA titles at high settings compress the gap because the GPU becomes the limiting factor. The practical takeaway is that a 1440p 144Hz display is well within reach of either CPU paired with a mid-to-high-tier GPU, but the 7800X3D provides more headroom for frame rate consistency.
4K
At 4K, the gap tightens further. Across the outlets that tested this resolution, the 7800X3D retains roughly a 5 to 10 percent advantage in most titles. This is the zone where the CPU comparison matters least for pure frame rate, but the 7800X3D’s superior minimum frame performance still reduces stutter in CPU-heavy scenes. If you game at 4K, the extra money for the X3D chip is harder to justify on raw FPS alone, though it remains a benefit for long-term headroom as game engines become more complex.
Power, Heat and Noise
Here is where the comparison produces a mild surprise. Despite a nominally higher TDP rating, the 7800X3D’s operating voltage is constrained by the stacked cache die, which limits thermal headroom and forces AMD to lock it at lower frequencies. Gamers Nexus measured the 7800X3D drawing roughly 55 to 75 watts during typical gaming workloads, which is comparable to or lower than the 7700X’s gaming power draw of approximately 65 to 85 watts despite the 7700X’s higher clock speeds. In sustained multi-threaded workloads, the 7700X can pull up to its full 105W package power ceiling, while the 7800X3D tops out around 120W. The practical difference in cooling requirements is minimal, and both chips can be handled by a good dual-tower air cooler. Neither generates noise concerns beyond what a standard cooler handles. The 7800X3D’s thermal ceiling of around 89 degrees Celsius before throttling is lower than the 7700X’s 95-degree limit, which is a direct consequence of the cache stack’s sensitivity to heat.
Features
Both CPUs share the same platform feature set: AM5 socket, PCIe 5.0 for discrete GPUs and NVMe storage, DDR5 memory support, and integrated RDNA 2 graphics for basic display output and media encoding. Neither chip includes dedicated hardware beyond what the integrated GPU provides, meaning H.265 and AV1 decode are handled by the Radeon 2 CU block rather than a dedicated NVENC or QuickSync equivalent. For content creators who stream, the integrated encoder is adequate for 1080p60 but falls short of a discrete GPU’s encoder quality. Upscaling and frame generation technologies like FSR and AFMF are GPU-driven features that operate identically regardless of which CPU you choose, though the 7800X3D’s higher frame times provide more headroom for frame generation to operate without introducing visible artifacts. Overclocking support is present on both chips, but the 7800X3D’s multiplier is locked and only allows undervolting and memory tuning, a meaningful restriction for enthusiasts who want to squeeze extra performance.
Price and Value
The launch gap of $100 has narrowed but not disappeared. When comparing effective cost per frame in 1080p gaming, the 7800X3D’s 20 to 25 percent performance uplift for a 28 to 30 percent price premium means it offers better value per frame in pure gaming terms. On the used market, both chips have depreciated at similar rates since they entered mainstream adoption, and the absolute dollar difference in second-hand pricing is smaller than it was at launch. For builders shopping used, the decision tilts further toward the 7800X3D since the cost gap shrinks while the performance gap remains. The 7700X’s value proposition strengthens if the saved $50 to $80 is redirected to a GPU upgrade, where it would yield a larger absolute frame rate gain at higher resolutions.
Who Should Buy Which
Competitive 1080p players
The 7800X3D. Frame time consistency and minimum FPS are the metrics that matter in shooters and racing titles at high refresh rates, and the cache advantage is most pronounced in exactly these scenarios. The extra $50 to $100 is a small tax on your competitive edge.
1440p high-refresh gamers
The 7800X3D, assuming you want to sustain 144Hz or 165Hz across a varied game library without worrying about CPU-bound dips. If your GPU is midrange and you are unlikely to push past 100 FPS, the 7700X saves money without meaningful compromise.
4K gamers
The 7700X is adequate. At 4K, GPU limitations dominate and the CPU gap narrows to single digits. Redirect the savings toward a better GPU, which will produce a far larger frame rate return.
Creators and streamers
The 7700X has a modest multi-threaded advantage over the 7800X3D in rendering, encoding, and compilation tasks, typically around 5 to 10 percent, because it runs at higher clocks. If your workload splits evenly between gaming and productivity, the 7700X is the more balanced choice and the cheaper one.
Upgraders from two generations back
Either chip represents a massive leap from a Ryzen 3000-series or Intel 10th-gen platform. The 7800X3D maximizes your new AM5 investment and is more likely to remain competitive as game engines evolve. The 7700X serves well but will feel the CPU-bound ceiling sooner as titles demand more cache bandwidth.
FAQ
Is the 7800X3D worth $100 more than the 7700X?
For a dedicated gaming build, yes. The cache advantage is persistent across game genres and does not diminish with future titles the way clock speed advantages do. For mixed-use builds, the value is less clear and the 7700X’s higher clocks serve productivity tasks marginally better.
Does the 7800X3D run hotter than the 7700X?
No. During gaming, the 7800X3D typically runs at equal or lower temperatures and power draw because its locked, lower voltage and reduced thermal headroom keep it operating at lower frequencies with excellent efficiency.
Can I overclock the 7800X3D?
Not meaningfully. The multiplier is locked, and the 3D V-Cache stack limits how much thermal headroom is available. You can tune memory timings and apply a negative voltage offset, but there is no overclocking equivalent to what the 7700X allows.
Will the 7800X3D bottleneck a midrange GPU?
No. The 7800X3D is faster than most GPUs can feed at any resolution above 1080p, making it an excellent pairing with any current or next-generation graphics card. Its strength is eliminating the CPU as a bottleneck.
Sources and Methodology
All performance figures, percentage ranges, and power measurements in this article are approximate ranges derived from the combined launch and long-term review data published by TechPowerUp, Tom’s Hardware, Gamers Nexus, Hardware Unboxed, and TechSpot. No numbers in this comparison represent independent testing conducted by this publication. Variance between outlets reflects differences in test benches, game selections, driver versions, and thermal configurations. Readers seeking exact figures for their specific hardware configuration should consult a benchmark tool relevant to their use case.