
Why raw benchmark numbers mislead more than they help
Most benchmark comparisons on YouTube and review sites run everything at stock settings, in a cold open-air test bench, with a 360mm AIO and perfect airflow. That’s not your case. A CPU that scores great in Cinebench on a reviewer’s bench can throttle 15-20% in a cramped mid-tower with two intake fans. Before you buy based on a chart, separate three things that get blended together: raw silicon performance, thermal headroom in a real case, and what the gain actually translates to in your use case. A 10% faster CPU means nothing if your workload is GPU-bound, and a GPU benchmark run at 4K tells you little if you game at 1080p where the CPU becomes the limiter instead.
- Why raw benchmark numbers mislead more than they help
- Figuring out which part actually limits you
- Cooling changes the benchmark more than the chip does
- GPU comparisons: where spending more actually pays off
- CPU comparisons: core count vs clock speed trade-off
- When the cheaper part is genuinely the right call
Figuring out which part actually limits you
The single most common mistake in a benchmark-driven upgrade is fixing the wrong bottleneck. If you’re gaming at 1080p or 1440p with a mid-range GPU, your CPU’s single-core performance and cache size matter more than people expect, especially in CPU-heavy titles like simulation or strategy games. At 4K, the GPU does almost all the work and a two-generation-old CPU often loses less than 3-5 fps compared to the newest chip. Check your GPU usage percentage in-game with a monitoring overlay before spending money: if it’s pinned at 99%, you’re GPU-bound and a CPU upgrade is wasted cash. If it’s bouncing around 60-80%, your CPU or RAM is the limiter.
| Symptom | Likely bottleneck | What to upgrade first |
|---|---|---|
| GPU usage pinned near 100%, low fps | GPU-bound | Graphics card |
| GPU usage below 90%, fps unstable | CPU or RAM-bound | CPU, or RAM speed/timings |
| High fps but frequent stutters | RAM capacity or storage | RAM to 32GB, or move to NVMe |
| Fps drops under sustained load only | Thermal throttling | Cooling, not the component itself |
Cooling changes the benchmark more than the chip does
This is the part most comparison charts skip entirely. A CPU rated for a 65W-125W range can pull well over 200W in short bursts under default motherboard power settings, and if your cooler can’t dissipate that, you lose the performance you paid for. The practical fix isn’t always a bigger cooler, sometimes it’s just setting realistic power limits in BIOS so the chip runs at a sustainable clock instead of boosting for ten seconds and then throttling for the rest of the session. That said, if you’re running anything above a mid-range chip, a basic 120mm air cooler is usually the actual bottleneck. Stepping up to a quality 240mm AIO liquid cooler typically drops load temps 10-15°C over a stock cooler, which is often the difference between sustained boost clocks and constant throttling in anything over 20 minutes of load.
GPU comparisons: where spending more actually pays off
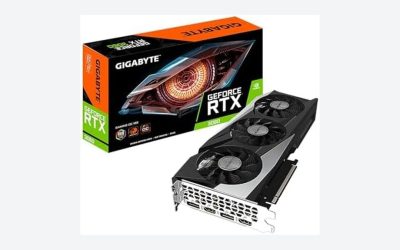
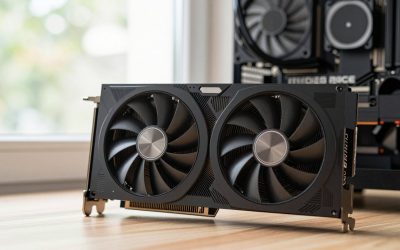
GPU benchmark charts are the most honest of the bunch because the workload (rendering frames) is consistent, but the trap is buying more GPU than your monitor can use. If you’re on a 1080p 60Hz display, a flagship GPU will sit idle waiting on the monitor most of the time, and you’re paying for headroom you can’t see. The upgrade only pays off if you also upgrade the display, or if you do GPU-bound work like video encoding or 3D rendering where the extra VRAM and compute matter regardless of a screen. For most people building a 1440p gaming rig, the mid-tier of the current generation gives you 90% of the frame rate of the flagship for notably less money, and that gap only widens at 4K where VRAM capacity, not just raw compute, starts to matter for texture streaming. If you’re shopping that bracket, browsing a 1440p gaming graphics card category and sorting by VRAM and current price gets you to the sensible options faster than chasing the top of any chart.
CPU comparisons: core count vs clock speed trade-off
Benchmark suites love to average gaming and productivity scores together, which hides a real trade-off. More cores help video editing, compilation, and streaming while gaming, but gaming itself mostly cares about single-core speed and cache size up to about 6-8 cores, beyond which extra cores sit idle in most titles. If your use is 90% gaming, don’t pay for a 16-core chip’s premium. If you edit video or run VMs, the extra cores are worth more than a slightly higher gaming clock speed. Check what you actually do most before trusting a single aggregate benchmark score.
| Use case | Priority spec | Where money is wasted |
|---|---|---|
| Gaming only, 1080p/1440p | Single-core speed, 6-8 cores | High core count chips |
| Streaming + gaming | 8+ cores | Marginal clock speed bumps |
| Video editing/3D rendering | Core count, RAM capacity | Top-bin gaming GPU |
| General office/browsing | Any current mid-range chip | Anything above entry-level |
When the cheaper part is genuinely the right call
If your case already has decent airflow (two intake, one exhaust, no dust filters clogged) a stock or budget air cooler is fine for anything that isn’t a top-tier overclockable chip. If you game at 1080p, last generation’s mid-range GPU usually still outperforms what you need and sells at a discount once a new generation launches. And if you’re not CPU-bound by your own usage pattern, a modest four-generation-old CPU with a fast NVMe drive and 32GB of RAM will outperform a brand-new CPU paired with a slow drive and 16GB, because storage and memory bottlenecks show up in everyday use far more often than raw compute ones do. Benchmarks compare parts in isolation. Your system is not isolated, and the balance between parts matters more than any single chart.