
Comparing PC parts gets confusing fast because manufacturers measure performance differently depending on what makes their product look good. GPU makers lean on gaming benchmarks, CPU makers lean on multi-core synthetic scores, and cooler makers lean on thermal numbers taken under conditions you’ll never actually run. Here’s how to actually compare parts in a way that tells you something useful before you spend money.
Comparing GPUs
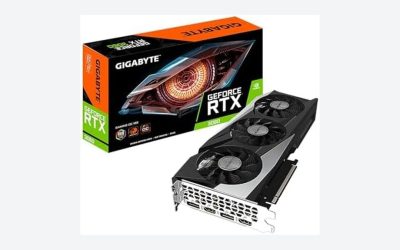
Raw spec sheets (CUDA cores, clock speed, VRAM) are close to useless for cross-generation or cross-brand comparisons. A GPU with more VRAM but an older architecture can lose badly to a newer card with less memory, because memory bandwidth and the underlying compute architecture matter more than capacity for most games under 1440p. The only numbers worth trusting are frames-per-second at the resolution you actually play at, from independent reviewers who test the same game suite across cards.
Where this bites people: buying a card with 16GB of VRAM expecting it to “future-proof” a 1080p build, when the actual bottleneck is the GPU core running out of steam two years before the VRAM does. VRAM matters more at 4K and for texture-heavy modded games than it does at 1080p/1440p.
| Comparison factor | Matters most for | Common mistake |
|---|---|---|
| VRAM capacity | 4K gaming, video editing, local AI models | Overweighting it at 1080p |
| Core/architecture generation | Raw frame rate at any resolution | Assuming more cores always wins across generations |
| Power draw (TDP) | PSU sizing, heat in small cases | Ignoring it until the PC trips a breaker |
| Driver maturity | Day-one game stability | Buying brand-new architecture at launch |
If you’re shopping, look at graphics cards find alternatives with reviews that include frame-time graphs, not just average FPS. A card that averages 90 FPS but stutters badly feels worse than a steady 75 FPS card.
Comparing CPUs
Multi-core benchmark scores (Cinebench, Blender render times) tell you about productivity work. They tell you almost nothing about gaming, where single-core/thread performance and cache size dominate. A 16-core CPU can lose to an 8-core CPU in gaming frame rates if the 8-core part has higher clocks and more cache per core. This is why “more cores” is a trap for anyone buying primarily to game.
The honest comparison framework: if you render video, compile large codebases, or run VMs, core count and all-core clock speed are what you’re paying for. If you game and occasionally stream, single-core performance and cache (particularly 3D-stacked cache designs) matter more, and you can often save $100-150 by skipping the top-tier chip without losing a single frame in practice.
| Use case | What to prioritize | What to ignore |
|---|---|---|
| Gaming only | Single-core speed, cache size | Core count above 8 |
| Streaming + gaming | 6-8 fast cores + 4-6 extra for encode | Flagship 16+ core parts |
| Video editing/3D render | Core count, sustained clocks | Gaming benchmark charts |
| General office/web use | Almost anything from the last 4 years | Spending more than $200 |
Comparing Cooling
Cooler marketing loves to quote dB(A) noise ratings and peak thermal dissipation in watts, both measured in ideal lab conditions you won’t replicate. In practice, a mid-range air cooler and an entry 240mm AIO liquid cooler perform within a few degrees of each other on most consumer CPUs. The real differences show up at the extremes: overclocked or power-hungry chips (anything pulling over 200W under load) benefit meaningfully from a 280mm or 360mm AIO, while a stock-clocked mid-range CPU is fine on air.
Failure modes to know about: AIO pumps eventually fail (usually 5-7 years, sometimes sooner), and when they do, you lose cooling fast with little warning. Air coolers fail more gracefully, their fans just get noisier and dustier over years. If you want a “buy once, forget about it” setup, a good air cooler is the lower-risk pick for anything other than a high-wattage overclocked build. Browse CPU coolers and check the TDP rating against your actual chip’s power draw, not its marketing name.
Comparing Whole Builds
When comparing two complete build lists, the mistake is comparing them part-by-part instead of as a system. A $1500 build with a slightly weaker GPU but a better case and PSU can outlast and outperform a $1500 build that dumped everything into the GPU and skimped on airflow, because thermal throttling from poor case airflow costs you real frame rate over long sessions. Budget allocation roughly in this order gives the best return: GPU first for gaming performance, then CPU matched to avoid bottlenecking it, then enough PSU headroom (aim for 20-30% above your measured draw), then case airflow, then cooling.
Storage comparisons are simpler than people make them: for gaming, the jump from a SATA SSD to NVMe gives you faster load screens but rarely more than 1-2 seconds difference in most games, so it’s not worth stressing over. For comparing NVMe SSDs, capacity and sustained write speed matter more than the headline sequential read number, especially if you’re transferring large files or working with video.
The pattern across every category here is the same: the spec that’s easiest to put on a box is rarely the spec that predicts real performance. Match the comparison metric to what you’ll actually do with the machine, and skip paying for headroom you won’t use.