
- Top Pick: Lenovo Legion Go 2
- Runner-up: Lenovo Legion Go S
- Also consider: ASUS ROG Xbox Ally
Every emulator player knows the feeling: a game runs fine for ten minutes, then something hitches, and the whole diagnosis from the couch is “it stutters sometimes.” This site already covers overlays for native PC games and settings that raise frame rates; this guide covers the other half — the counters built into the emulators themselves, and how to read them. It assumes you play from game files and system files dumped from hardware you own.
As an Amazon Associate, we earn from qualifying purchases.
An emulator FPS counter overlay earns its place because emulation has a secret native games do not: there are three different numbers all calling themselves FPS, and only one of them tells you whether the game is running correctly. Below are the readouts each project documents, what each number means, and how a frame-time graph separates a CPU limit from a shader hitch from a sync mismatch — three faults that feel identical and take opposite fixes.
This guide contains affiliate links; if you buy through them, the site may earn a commission at no extra cost to you.
Quick Answer
Turn on the counter built into your emulator first: RetroArch’s framerate display and statistics HUD, PCSX2’s on-screen display under Settings, Graphics, OSD, or Dolphin’s Show FPS. On Linux, MangoHud adds the external overlay. Then read the frame-time graph, not the average: spikes mean hitches, a sagging line means a CPU limit, and a flat line at the game’s original rate means correct.
Three Numbers All Wearing the Same Name
The first number is the emulated game’s own rate. Consoles ran at fixed video rates, and PCSX2’s FAQ documents the nominal figures: 59.94 frames per second for NTSC games and 50 for PAL. A PS2 counter locked near 60 does not mean your graphics hardware is loafing; it means the emulator is at full speed, which is the entire goal.
The second number is what the emulator actually outputs. Libretro’s documentation splits this cleanly in RetroArch’s statistics: Core AV_INFO->FPS is the exact frame timing the core is requesting, while Video->FPS is the rate at which you are currently outputting actual frames. Those two can disagree, and the disagreement is the diagnosis.
The third number is what reaches the panel after sync. The same Libretro page states that with variable refresh rate on, Video->FPS should match the core’s requested rate; with it off, the output should sit close to your refresh rate divided by the vsync swap interval. It also warns that neither figure shows 30 for 30 fps content most of the time, because internal frame doubling is performed — a counter reading 60 over a 30 fps game is not lying.
The consequence: in emulation, a flat line at the game’s original rate means correct. Chasing a bigger number is chasing a setting, not performance.
The Built-In Counters, Project by Project
RetroArch offers two layers. The framerate display is the glanceable counter. The deeper tool is the running statistics HUD that Libretro’s vsync documentation names at Settings, then User Interface, then On-Screen Display, then On-Screen Notifications, then Notification Visibility, then Display Statistics. It lists the core’s requested rate, your configured refresh, the actual output rate and an audio underrun tracker side by side. That same documentation cautions that an external monitoring program can introduce some jitter itself — one reason to start with the built-in readout.
PCSX2 keeps its counters at Settings, then Graphics, then OSD, and the project’s performance troubleshooting guidance sends users there before anything else, because the numbers locate the bottleneck. The OSD can show game FPS, video output FPS, speed percentage, VRAM use, draw calls, render passes, readbacks, texture uploads and copies. Read them as a split: if speed percentage falls while the rendering counters stay calm, the limit sits on the emulated processor side; if readbacks and uploads spike, the rendering work is the cost. No single number identifies anything; the panel together does.
Dolphin is the minimalist: a Show FPS checkbox in the graphics settings draws the current rate in the corner of the screen. There is no graph and no load panel, which makes it a before-and-after tool rather than a diagnostic bench — raise the internal resolution one step, watch whether the number holds, roll back if it dips.
MangoHud: The Overlay Linux Adds
MangoHud’s own README describes it as a Vulkan and OpenGL overlay for monitoring FPS, temperatures, CPU and GPU load and more. Four parameters are enabled by default: fps, frame_timing, cpu_stats and gpu_stats. That default matters, because frame_timing is the frame-time graph — the single most diagnostic element in this guide — on out of the box.
Configuration lives in MangoHud.conf files or the MANGOHUD_CONFIG variable, and the README documents launching by prefixing the program name with mangohud, or adding it to a Steam game’s launch options. The HUD toggles with Shift plus right F12 by default, and logging toggles with Shift plus left F2, writing FPS logs you can compare before and after a settings change. On Linux PCs, Linux handhelds and SteamOS installs, MangoHud covers emulators with no counter of their own — one graph, drawn the same way, across every program.
Reading the Graph: Three Signatures
The sag: frame rate and emulation speed slide down together and stay down in busy scenes, while the frame-time line rises into a plateau. That is a CPU-bound emulator — the cost is the emulated processor’s work, not the picture. The fix direction is lighter accuracy settings, not a lower resolution first.
The spike: isolated frame-time needles, typically when entering a new area or seeing an effect for the first time, while the average looks healthy. First-visit shader compilation is the classic cause, and the counter proves it, because the second run through the same scene comes back clean. An average hides this fault completely; the graph is the only witness.
The clean number that still feels wrong: FPS steady at target, frame times even, motion juddering anyway. That is presentation, not power — a vsync or swap-interval mismatch, or a variable-refresh panel not syncing to the content rate. RetroArch’s statistics make it visible: output should match the core’s request on a VRR panel, or sit at refresh divided by swap interval without one. If it does neither, work on the sync chain.
Whatever the signature, the rule is the same: change one setting, replay the same scene, compare the same readout. Numbers you cannot reproduce are decoration.
Hardware Where the Readout Earns Its Screen
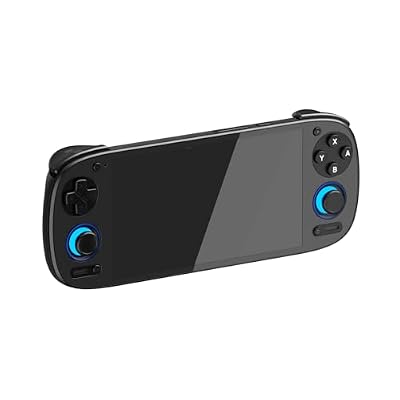
Lenovo Legion Go 2

The heavy tiers are where diagnosis pays: PS3-class and Xbox-class emulation lives or dies on CPU headroom, and this handheld has headroom to measure. The 8.8-inch OLED leaves room for a statistics readout without covering the game.
- Chip: AMD Ryzen Z2 (8 cores, 16 threads, up to 5.1 GHz per Lenovo PSREF)
- Memory: 32GB LPDDR5X, configuration as listed
- Storage: 2TB NVMe, M.2 2280 slot
- Display: 8.8-inch OLED, 1920×1200, 144Hz
- Battery: 74Wh
Lenovo Legion Go S

The variable-refresh machine: a 48 to 120Hz panel is where presented rate versus game rate stops being theory and becomes something you can watch. This listing is the Z2 Go Windows 11 configuration; other configurations share the name.
- Chip: AMD Ryzen Z2 Go (4 cores, 8 threads, up to 4.3 GHz per Lenovo PSREF)
- Memory: 16GB LPDDR5x-6400
- Storage: 512GB, M.2 2242 slot
- Display: 8-inch, 1920×1200, 48-120Hz variable refresh
- Battery: 55.5Wh
- Weight: about 740g
ASUS ROG Xbox Ally

The base Xbox Ally pairs Windows — so the PCSX2 OSD and RetroArch statistics run natively — with a 120Hz FreeSync Premium panel that makes sync mismatches visible instead of theoretical: the sync-signature test bed of this group.
- Chip: AMD Ryzen Z2 A (4 cores, 8 threads, RDNA 2 graphics)
- Memory: 16GB LPDDR5X-6400
- Storage: 512GB, M.2 2280 slot
- Display: 7-inch IPS, 1920×1080, 120Hz, FreeSync Premium
- Battery: 60Wh
- Weight: about 670g
See the ROG Xbox Ally on Amazon
Beelink SER8 Mini PC

The desk route: a mini PC puts the overlay on a monitor, next to a real keyboard, where configuration files and per-game settings get edited. The 8745HS and its 780M graphics give the counters a classic-tiers-plus workload.
- Chip: AMD Ryzen 7 8745HS
- Graphics: AMD Radeon 780M integrated
- Memory: 32GB, as listed
- Storage: 1TB, as listed
- Form factor: mini PC, ships as a Windows machine
See the Beelink SER8 on Amazon
Logitech K400 Plus Wireless Touch Keyboard

Overlay work is hotkey work: MangoHud’s toggles are F-key chords, and config files do not edit themselves. On a docked handheld, this compact board and its touchpad make the readout usable from the couch.
- Layout: compact keyboard with integrated touchpad
- Connection: USB receiver (Logitech Unifying)
- Battery life: up to 18 months, Logitech’s rating
- Role: the input half of a docked overlay setup
How to Choose
Start with the counter your emulator already has. It reads the emulator’s own numbers — speed percentage, the core’s requested rate — which no external tool can see, and costs nothing to run. Add MangoHud when you play on Linux, when an emulator has no graph of its own, or when you want one readout plus logging across everything.
Pick the readout by the question. “Is it full speed?” is an FPS and speed-percentage question. “Why does it hitch?” is a frame-time graph question. “Why does it feel wrong at full speed?” is a presented-rate versus requested-rate question, answered by the statistics split. Every machine above runs the classic tiers comfortably; buy headroom for the tier whose dips you plan to diagnose, not for the counter itself.
Who Should Skip
Skip the overlay habit if your games already hold their original rate and feel right — a counter adds nothing but clutter to a solved problem. Skip it, too, if you are hoping a readout raises performance: overlays diagnose, they do not fix, and stacking several at once can muddy the very numbers you are reading. And skip the chase above the original rate: the target is the rate the game was built for, and everything past it is effort spent measuring the wrong thing.
FAQ
Why does the counter show 60 in a game that ran at 30?
Frame doubling. Libretro’s documentation notes that its FPS figures will rarely display 30 for 30 fps content because internal frame doubling is performed: the display chain presents frames more than once while the game’s logic still updates at its original rate. The counter reports the output honestly; it is simply not the number you assumed.
Does running an overlay cost performance?
A little work, yes. RetroArch’s own vsync documentation cautions that an external monitoring program is possibly introducing a small amount of jitter itself. Built-in counters are the lightest option. If a hitch vanishes the moment you close the overlay, suspect the observer before you suspect the emulator.
Why does the graph spike when I enter a new area?
New shaders and textures are being prepared — the classic first-visit hitch. The test is repetition: run the same scene again. If the spike is gone, it was compilation, and the work is cached. If it returns identically, look at CPU load or storage.
Can an FPS counter fix my stutter?
No. It separates three causes — CPU limit, shader hitch, sync mismatch — that feel identical from the couch and take opposite fixes. The fix is the setting you change afterwards, once the graph has told you which cause you actually have.
Final Verdict
The best emulator FPS counter overlay setup is deliberately boring: the built-in readout first, MangoHud where Linux or a missing graph demands it, and the discipline to change one setting at a time. Learn the three signatures and “it stutters sometimes” becomes a sentence with a subject. The win condition is a flat line at the rate the game was built for — everything above that is decoration.